We have big data, but we need big knowledge -
weaving surveys into the semantic web
Abstract
The semantic web aspires to improve the accessibility of information to automated systems as much as the regular WWW makes information accessible to human users. Moreover, the standards and tools of the semantic web are designed to exploit so far as possible the resources that are already in place delivering that regular web.
In this brave new world a question to your smartphone like "What is the readership of The Times in Humberside?" can be answered as cogently as "What is the population of Brazil?" - and both of them better than they are at present (do try this at home).
At the other end of research, as soon as you learn a respondent lives in postcode sector KT6 your questionnaire can be steered by knowing this is a low-crime, high-income, highly-urbanised area.
This paper shows how behind the scenes the tools to realise this and other ways to enhance the collection and usage of our data are falling into place.
It introduces the technologies that have been developed for knowledge processing and points the way to how they may be used to great advantage within survey organisations.
Finally, it presents the results of a practical project that has developed a tool to convert Triple-S survey data into semantic data and shows how a diversity of analyses of data and metadata across multiple surveys can be greatly simplified using semantic web tools.
Contents
1 Review of Resource Description Framework
1.1 What is “knowledge” anyway?
1.1.4 RDF and knowledge representation
1.2 Representing data as graphs
1.3 Stepping towards the Giant Global Graph
1.4 Establishing Unique Identifiers using URIs
1.4.1 URIs in our geography graph
1.4.2 Accessing RDF data using URIs
1.5 Storing and retrieving RDF
Data Documentation Initiative (DDI) RDF Vocabularies
1.8 RDF in consumer survey research
2.1 Rendering Triple-S data as RDF
2.1.1 Triple-S metadata expressed as RDF
2.1.5 Extending the model with case data
2.1.7 Modelling aggregate data
1 Review of Resource Description Framework
1.1 What is “knowledge” anyway?
1.1.1 Knowledge based systems
At the time of writing there is a lot of discussion of knowledge-based systems, knowledge engineering, corporate knowledge et cetera, as if knowledge were a readily quantifiable, almost material, asset.
There are several publicly available knowledge engines that permit queries of (at least some of) the world’s shared knowledge:
· Siri (Apple):
· Evi (Amazon):
The existence of these services begs some questions:
· How do these services make knowledge computable?
· How do I add my own private knowledge to the mix?
One thing the providers of these services have in common is that they disclose very little of their internal mechanisms. Another is that they are able to process data that has previously been qualitative, such as contact lists and friend lists, as if they were quantitative. The effect on many users was well described by Arthur C Clarke in the phrase “Any sufficiently advanced technology is indistinguishable from magic” (Clarke, 1961).
However there has been a lot of research and development in the area of knowledge processing over the last twenty years, without much awareness in the computing mainstream. This paper attempts to shed some light on this work by demonstrating their application to survey data. NB: the use of the term “graph” is significant.
1.1.2 Concept of knowledge
There is neither space nor scope here to discuss the philosophical concept of knowledge. A readable introduction may be found in (Russell, 1926).
For our present purposes we will consider an item of knowledge to be a “justified true belief”.
In that context, a data item is knowledge by virtue of:
· Justification: the status of the owner of the database is the provenance of its contents (“the bank (or whatever) can be trusted to maintain correct information”)
· Truth: the presence of the item is an assertion of its truth (“it says so in the database so it must be true”)
· Belief: using the database implies belief in the data
In addition, many databases have a “closed world assumption” – that anything not included is therefore not true (“there’s nothing in the database about it so it didn’t happen”).
1.1.3 Data “islands”
Framing this more specifically, a typical employee database will have an implicit closed world assumption - no one is an employee without having a record in the database. The justification for belief is not articulated but is trust in the organisations' HR department.
The world is full of these islands of knowledge, each with their own closed world. The pragmatic difference between data and knowledge is that knowledge can be shared and reused in contexts different from where it originated.
To treat these employee data as knowledge in the wider world and mix them with data of other kinds and other sources we must make the provenance explicit and qualify the closed world assumption.
If we have consolidated several employee databases and we search for a specific person we may find:
· no record of their salary if she is not an employee of any of those organisations
· a salary provided by one organisation
· salaries from more than one organisation
There are further issues arising:
· The different databases have different schemata - so how can we know that "empID" in one database is the same concept as "employee_id" in another?
· The same person may have different employee ids in different databases but needs to be recognised as the same person.
· Different databases may have structural differences, for instance one may have a concept of employment episode as being distinct from employment.
1.1.4 RDF and knowledge representation
Our existing databases have the same inadequacies as students complaining that examinations are too hard:
“As novices, students naturally compartmentalize what they learn according to the specific context in which that learning occurred. This makes it difficult for students who haven’t mastered the material to (1) recognize when they have applicable knowledge that they could use in the current situation and then (2) recall and apply that knowledge accurately and appropriately. A further complication occurs when students simply assume that what they have learned in one context can be forgotten after the current test or semester” (Solve a teaching problem)
This describes well the distinction between big data, and big knowledge.
The semantic web provides tools to help us make our data practically shareable and reusable in new situations, i.e. to deploy our data as knowledge. These tools are centred on the Resource Description Framework, or RDF, probably the most undervalued and underused technology in modern computing.
The key features of RDF are:
· RDF is a set of standards for communicating and querying information by expressing the information in the form of graphs (in the mathematical sense, not in the sense of charts)
· RDF has been standardised and refined over the last 15 years and is published as a number of W3C recommendations, very widely implemented both in open source and commercially.
· Data structures including databases may be represented as directed graphs.
· Directed graphs may be represented as a list of “triples” which are easy to serialise for transfer and to store en mass for querying.
· Graphs may be merged into bigger graphs by combining their triples, creating a Giant Global Graph as a computer-oriented representation of the same information accessed by humans in the World Wide Web.
This paper strives to show that questionnaire survey data are especially valuable to manage with RDF.
1.2 Representing data as graphs
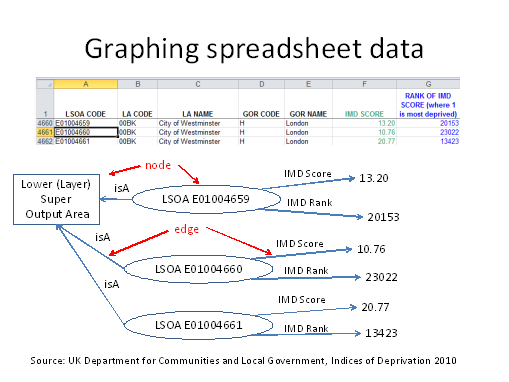
This spreadsheet assigns an index of deprivation to each UK Office for National Statistics Lower Layer Super Output Area or LSOA. An LSOA is a low-level unit of UK statistical geography. The index (http://data.gov.uk/dataset/english_indices_of_deprivation) is a composite of several dimensions of deprivation.
Each spreadsheet row specifies an LSOA and several of its properties. For our present purpose we are concerned with the IMD score and rank amongst all LSOAs.
This structure is typical of data spreadsheets. A worksheet contains one row for each item (or “subject”) in some category, in this case LSOAs, with one column specifying an item identifier, column A in this case, and the other columns specifying item properties.
This may be represented by a graph as shown in the diagram, where there is a node or vertex for each item. Each item node has a link or edge to each of its properties, and that link has a label. Note especially the “isA” property linking a node to another node that identifies the category being modelled in the spreadsheet. In this example the node for each LSOA has a link to a node that models the class of LSOAs. This makes it possible to identify all the LSOAs by the presence of links from the item nodes to the class node. In relational terms the LSOA code is the primary key.
The graph may itself be represented by a list of triples, one for each edge or link in the graph. Each triple has the following components:
· An identifier for the start node or source of the link: known as the “Subject” of the triple in RDF.
· An identifier for the nature of the link: known as the “Predicate” of the triple.
· An identifier for the end node (or sink) of the link, known as the “Object”.
The object of a link may be a scalar value (such as 10.76) or a node.
The triples that emerge from this example are as follows:
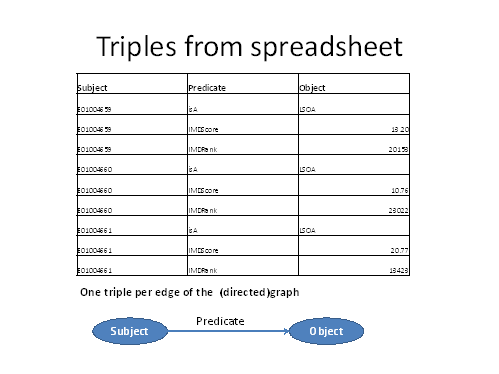
We have extracted one triple for each cell of the spreadsheet that interests us.
The RDF terminology of subject, predicate and object emphasises that each triple is like a simple statement of fact in natural language: “E01004659 is a LSOA”; “E01004659 has an IMDScore of 13.20”. The graph contains quite a large number of such facts, some tens of thousands in all.
Now let’s consider some other related data we might want to integrate with the deprivation data. These are also UK public open data, but this time provided as .CSV files.
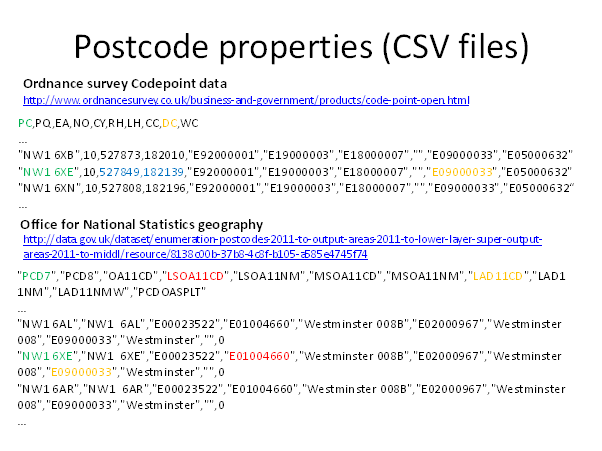
Here the rows of the files correspond to UK postcodes - even smaller geographies than LSOAs. There are several interesting properties recorded in these files, including an LSOA for each postcode (column LSOA11CD) from the ONS, and UK Ordnance Survey Eastings and Northings (expressions of longitude and latitude respectively). So in principle we can now form a big graph where we know the position and LSOA of each postcode, and the deprivation score of each LSOA, and therefore the deprivation score for each postcode – a clue to the personal situation of any survey respondents living at that postcode.
First though, some technical observations:
· LSOAs were subjects in our first file, but are objects in these new files where the subjects are postcodes. In relational terms, the LSOA is a foreign key.
· Postcodes have two alternative identifiers in the ONS file, PCD7 and PCD8. It is the PCD7 column that matches the PC column in the OS file. We need to select one to use as the subject identifier for each row, and PCD7 is the obvious candidate.
· LSOAs are in column “LSOA Code” in the first spreadsheet but in column LSOA11CD in the ONS sheet.
It is easy to see how triples can be created from these two CSV files in the same way as the spreadsheet. If we combine all three sets of triples we get a composite graph that now includes several million nodes. Graphs like these amount to many millions or billions of triples.
The same process can be applied table by table to a relational database.
Let’s now look at a fragment of the geography graph we have created:
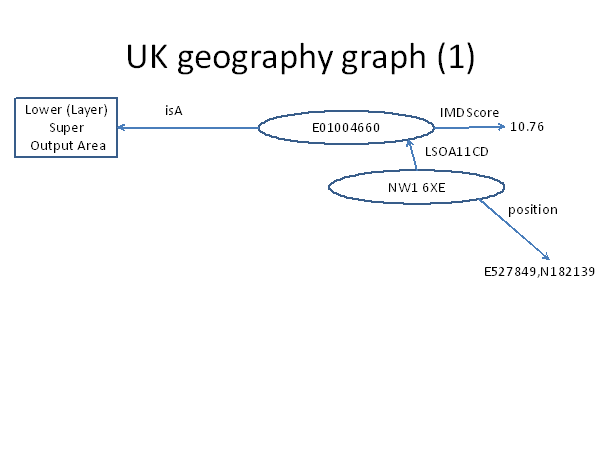
Here we see that by following the LSOA11CD link from postcode NW1 6XE we find its LSOA (E01004660) and its properties including the IMDScore of 10.76.
If we conduct online interviews with some respondents, each of their responses may also be modelled as a graph and added to our geography graph. We will discuss how this can be achieved in practice later, but for now let us suppose we have added triples for postcode and time of interview for each respondent. The following graph is for a hypothetical respondent id 12345 who replied from postcode NW1 6XE at 10:45 on the morning of 9 September 2014.
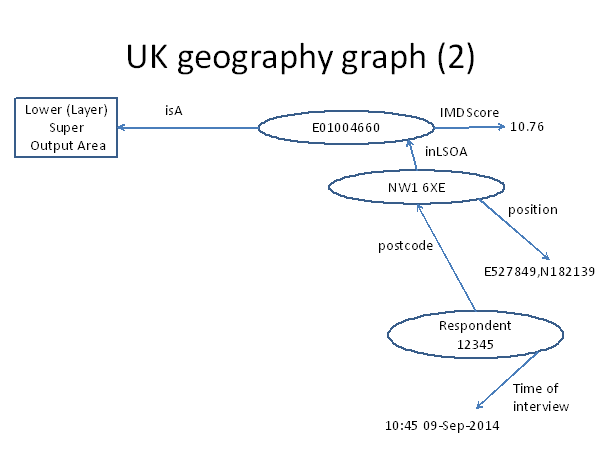
By benefit of the graph, the respondent is linked to a postcode, and therefore to an approximate physical location. Via the postcode, the respondent is linked to an LSOA and therefore a deprivation index. There are many other LSOA attributes published by ONS, including distributions for all the UK census questions, and the graph can be extended to include all of these.
For now though, let’s bring in data from a third UK government agency, the Meteorological Office. Observational data are published online at http://data.gov.uk/metoffice-data-archive including hourly measurements from 150 stations around the UK. We can exploit these with some straightforward steps:
· Derive the nearest weather station for each postcode from the known locations of postcodes and weather stations
· Add this information as a new link/triple for each postcode.
· Derive the nearest hour for each interview time as an observation time.
· Add this information as a new triple for each respondent.
Let’s look at the graph now:
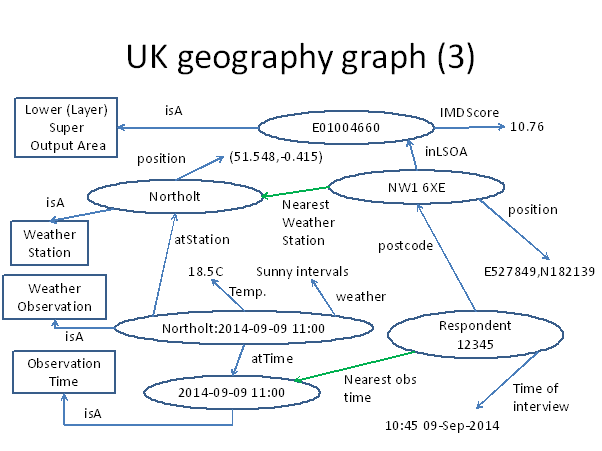
Now the respondent 12345 is linked through their postcode NW1 6XE to weather station Northolt, and through the “nearest observation time” of 11:00 to the specific observation at Northolt. We therefore see that they were enjoying sunny intervals and a temperature of 18.5C. Who knows whether the sunny weather provoked a sunny disposition in our respondent affecting the attitudes that they expressed in their responses? This is a question that was previously difficult to investigate but has now become simple if we take advantage of Public Open Data and RDF technology.
1.3 Stepping towards the Giant Global Graph
Why the interest in NW1 6XE specifically? The postcode has one very famous resident:
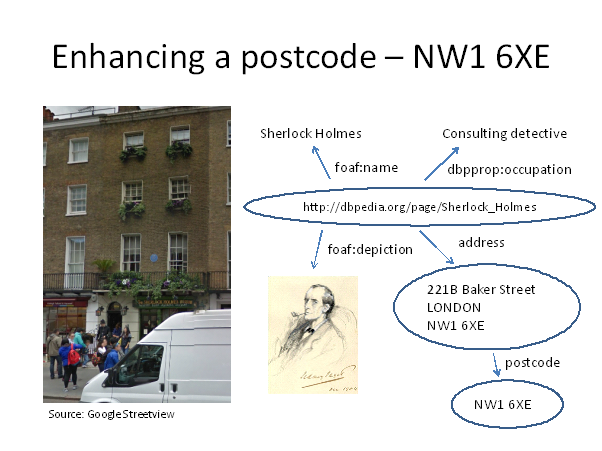
In general there are several addresses at each UK postcode. There is a catalog of these addresses, long familiar as the Post Office Address File. These data are available on commercial terms though not (yet) as Public Open Data.
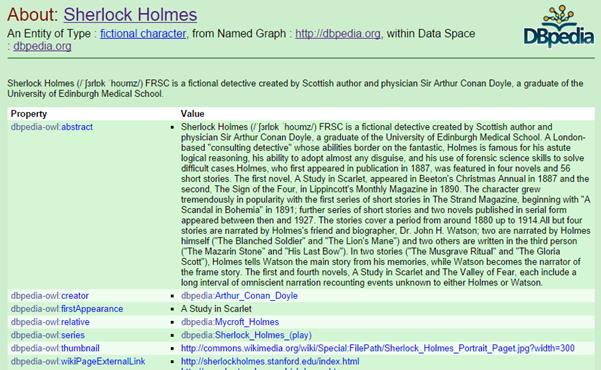
The famous address within NW1 6XE is the residence of Sherlock Holmes. Now we can create an intersection between our powerful but frankly unexciting geographic database and the information in the Giant Global Graph.
One component of the GGG is dbpedia – an RDF formulation of the information in Wikipedia. A small fragment of the dbpedia entry for Sherlock Holmes is shown above. A rich subject like Sherlock Holmes may have a large graph all of its own.
Note that the subject of Sherlock Holmes has its own URI: http://dbpedia.org/resource/Sherlock_Holmes.
Dbpedia knows a lot about Sherlock Holmes – but we know a lot about his postcode. RDF allows us to integrate this knowledge and explore it in combination.
At this point two difficulties begin to emerge:
· Wikipedia entries are not all about fictional detectives. Each domain of interest has its own concerns and therefore there is a huge number not just of subjects (rows, in the spreadsheet context) but of predicates (columns). There is potential for both ambiguity and inconsistency.
o Inconsistency, because the same relationship may be expressed with different names in different contexts – like the PC column in one CSV file and PCD7 column in another. This means that some nodes that should be recognised as the same will be treated as distinct.
o Ambiguity, because although a postcode of the form “NW1 6XE” cannot be confused as a subject with LSOA “E01004660”, in a global context UK postcodes and Canadian postcodes have a similar format, and who knows there may well be some digital camera in a catalogue out there with product code “E01004660”. So there will be some nodes that should be distinct but are treated as the same.
· We can’t snapshot the whole world’s data in one big private graph of our own. The strength of the World Wide Web comes from links between web sites that are curated and served separately. We don’t capture a private copy of the web in order to browse it. Can we organise the GGG like the WWW, so that we can analyse data from diverse sources without having to download it all?
The sublime beauty of RDF is that it overcomes both these difficulties by leveraging two fundamental components of the World Wide Web: Universal Resource Identifiers (URIs) and HyperText Transfer Protocol (HTTP).
In everyday use of the web Universal Resource Locators (URLs) are more familiar. What’s the difference?
1.4 Establishing Unique Identifiers using URIs
RDF enlarges the meaning of “resource” from the original rather specific concept of a digitial web asset to mean anything we want to collect information about. So in an RDF context “resource” is a term conflating the meanings of the everyday words “topic”, “subject”, “concept”, “thing” and “idea”. This rather arcane usage is the price we pay for inheriting all of the terminology relating to resources in the WWW.
For RDF purposes, individual postcodes, LSOAs, respondents, weather stations and weather observations are all resources and require URIs as their identifiers.
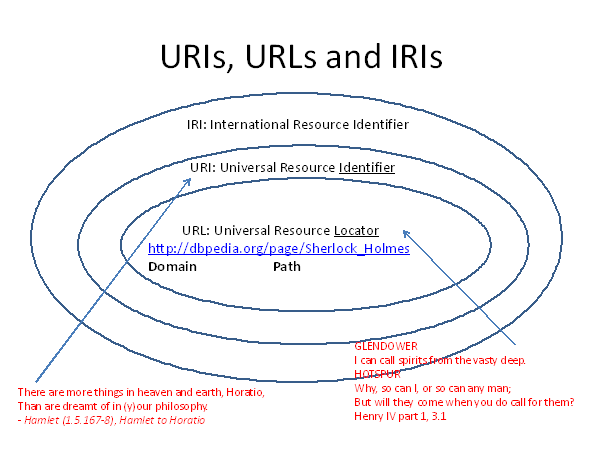
Shakespeare contributes two key insights to help us distinguish URIs from URLs.
There may indeed be more things in heaven and earth than we can dream of, but this implies the existence of a set of things we can dream of. The members of this set can all be assigned URIs.
However, a URI can be split into two components – the protocol plus domain name, and the path. Anyone can devise any URI that they chose – but if they use that as a URL to summon content from the vasty internet, then they will only get a response if they use a domain that is registered and managed, and they only get the response that the owner of that domain chooses, if any.
This familiar distinction allows entities that are recognised controllers of some subject area to assert URIs within domains of their own. So, as proprietor of the domain x-mr.com, X-MR Limited can “mint” URIs like http://rdf.x-mr.com/mySubject and be confident that no one else can use them with a different meaning. The W3C recommends that RDF users provide service for their URIs as URLs just so that RDF documents incorporating their URIs can be authenticated.
NB: IRIs are URIs enhanced to include Unicode characters
1.4.1 URIs in our geography graph
In the development of the geography graph above we assumed for purposes of illustration that there was no existing RDF formulation of the data. In fact the sponsors of the Deprivation Index, the UK government Department for Communities and Local Government have set up the domain opendatacommunities.org, with a web site http://opendatacommunities.org/ to publish the data that they curate.
The site enables you to download many geographic and statistical data as RDF documents, and provides URIs for resources such as postcodes and enumeration areas. For instance:
· NW1 6XE has URI http://data.ordnancesurvey.co.uk/id/postcodeunit/NW16XE
· E01004660 has URI http://opendatacommunities.org/id/geography/lsoa/E01004660
· Concept of a LSOA has URI http://opendatacommunities.org/def/geography#LSOA
NB: These URIs conform to W3C best practice by not only responding, but by using content negotiation to redirect to a URL most appropriate to the needs of the access. If you access these URIs with a web browser you will be redirected to an HTML page with relevant information. If you use an application to make the access you can request a response in an RDF serialisation format so that it can be loaded into a graph.
Now we and other consumers of UK geographic data can use these URIs as identifiers in our RDF graphs instead of raw postcodes or LSOA codes. In this way we can develop our graphs independently yet still be able to merge them sometime in the future without any further processing, forming a larger graph of collective knowledge about these geographies. We are also free from concern that if we add Canadian data to our graph there may be confusion of postcodes.
1.4.2 Accessing RDF data using URIs
The following shows some of the HTML page returned if you access the Sherlock Holmes dbpedia URI in a browser:
On the other hand, if you use an application to ask dbpedia for the RDF, you get :
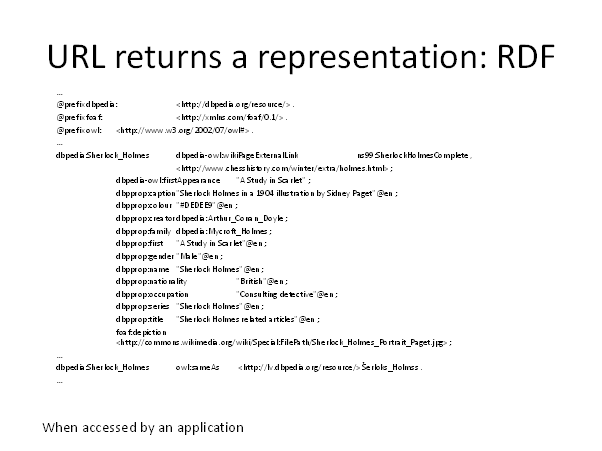
This format is N3, one of the various standardised serialisations of RDF. Normally RDF documents are exchanged between systems rather than examined by humans, but it is convenient sometimes as now to be able to review RDF content. It’s not necessary to understand the format fully for our purpose here, but the following notes may be helpful:
· Full URIs are inconvenient to read, so @prefix, closely analogous to an XML namespace, introduces a shorthand for the most common unvarying parts of most URIs in a document. For instance “dbpedia” is declared as a prefix for http://dbpedia.org/resource/
· Any full URIs in the document are enclosed in angle brackets.
· Some triples are written out in full and terminated by a period.
· If a triple is terminated by a semicolon this means that the next triple will take the subject of the current triple, and only the predicate and object need be specified.
· All of subject, predicate and object may be URIs, but only objects may have scalar values like “Consulting detective”@en.
Any duplicate triples added to RDF graphs are ignored – this is especially convenient when combining graphs. However, the same combination of subject and predicate may have several triples with different objects – for instance translations of “Consulting detective” with different language tags.
1.5 Storing and retrieving RDF
So far we have talked about RDF conceptually but how do you work with it in practice? Let’s compare working with RDF with working with an SQL database.
You may extract some RDF from a public external source, or you can create it for yourself from existing data. We will come on to some methods for you to create RDF.
1.5.1 Serialisation formats
RDF documents are just lists of triples, so there is no metadata to accompany them – RDF documents are self-contained.
Serialisation formats are for storing RDF in flat files or transmitting RDF in HTTP requests. The main reason to select one format over another is if you intend to process the RDF in an application that isn’t using one of the RDF libraries that are available for all major programming languages. Pretty much every format is supported by every triple store, for import and for export.
• N3: http://www.w3.org/TeamSubmission/n3/Turtle
• N-triples: http://www.w3.org/TR/n-triples/
• JSON-LD: http://www.w3.org/TR/json-ld/
• Turtle: http://www.w3.org/TR/turtle/
• RDF/XML: http://www.w3.org/TR/REC-rdf-syntax/
There is no equivalent to serialisation in the SQL world because SQL does not define a way to package an ensemble of schema and data arising from a query and transmit it to a receiving database reconstructing the schema and populating the rows; let alone doing this between say an Oracle and a MySQL database.
1.5.2 Triple stores
Triple stores offer far greater operational flexibility than SQL databases because:
· Serialisation allows you to move subsets of your triples between different stores at will
· The SPARQL query language, the equivalent of SQL, is well standardised (http://www.w3.org/TR/sparql11-overview/) and inherits much from SQL
· The SPARQL language itself has several faithful implementations
· The standard defines the format of SPARQL queries as HTTP requests including the results of queries
· A single SPARQL query can access both local and remote triple stores and integrate the results.
1.5.2.1 Storage alternatives for triple stores
This is not a comprehensive review of the options. The author has personal experience of using Bigdata and rdflib to prepare the material presented later in this paper. A reader interested in implementing a triple store might like to read some benchmark information with the caveat that all such information is inevitably slightly behind the leading edge.
• Flat files in a serialisation format
• Custom triple store, e.g.
– 3Store http://sourceforge.net/projects/threestore/
– Bigdata (http://bigdata.com/)
• Triple store layered on SQL database
• Hybrid SQL/post SQL: Virtuoso (http://virtuoso.openlinksw.com/)
• Triple store layered on graph/NoSQL database
1.5.2.2 Libraries to decouple your code from your storage strategy:
• Java: Sesame (http://openrdf.callimachus.net/)
• Python: rdflib (https://github.com/RDFLib/rdflib)
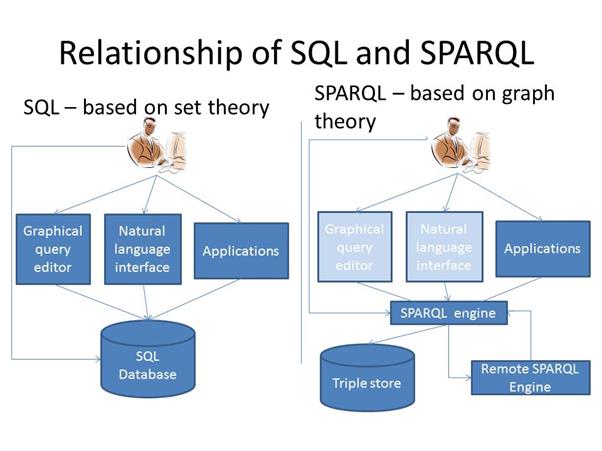
The boxes for advanced user interfaces to SPARQL databases are lightened to reflect the present immaturity of the technology, though there are implementations already.
1.6 The need for ontologies
The ownership of subject domains is not always clear-cut. The UK government may be the obvious arbiter of geographic information in the UK, but no one has ownership of the concepts of personal identity or friendship or ‘liking’ that are fundamental to social network data. To resolve this we need to bring in the concept of ontologies.
Rather like “resource”, “ontology” is a word that in the RDF world has a meaning somewhere in this cloud:
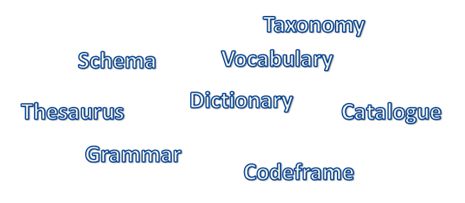
Ontologies are the RDF equivalent of schemata in database systems or XML schema for XML documents. These are the key things to know about ontologies as compared to schemata:
· Ontologies are optional – you can do a lot of useful work without them
· There are existing ontologies for most important domains of knowledge
· They are intended for use in many contexts rather than one implementation
· Anyone can create a new ontology
· Ontologies can be retrospective – you can add them after you’ve created your RDF data
· They are themselves described by RDF graphs (and therefore there are meta-ontologies for creating such descriptions)
The first point is particularly important because space does not permit significant coverage of ontologies here.
1.6.1 Ontologies in practice
There are two schools of thought on how we should deploy ontologies.
· Create an ontological “theory of everything”, i.e. one giant ontology to link them all.
· Create many domain-specific ontologies independently, accepting that there will be overlap and competition, and providing mechanisms to deal with the results.
Pragmatists might instinctively feel that the second approach would be more effective.
However there is a very powerful group behind schema.org (principally Google, Microsoft, Yahoo and Yandex) whose intention is to provide an ontology (that they refer to as a collection of schemas) for everything of importance to search engines, which by definition is everything of importance to economically active people.
Schema.org is important because their vocabularies may be used to embed triples as hidden “semantic” markup in regular HTML pages that all the major search engines will understand. Shrewd webmasters use schema.org mark-up so that search engines will extract the data they wish to share into prominent “rich snippets” in search results. Search engines support several methods of expressing semantic mark-up including a variant of RDF, RDF-a.
In the second group there are ontologies that have emerged over the years in response to the needs of various important domains. Particularly important and widely used are:
· RDF schema (a W3C standard): http://www.w3.org/TR/rdf-schema/
· Friend of a Friend (foaf): http://www.foaf-project.org/
· Good Relations: http://www.heppnetz.de/projects/goodrelations/
The search engines are however themselves pragmatic and will take note of information marked-up using any of the widely used ontologies.
1.7 RDF in the wild
1.7.1 BBC
The first major organisation to go public with exploiting RDF on an enterprise basis was the British Broadcasting Corporation. The BBC used RDF to model the data associated with the 2010 World Cup – teams, players, fixtures, venues, stories. It was successful and the BBC moved on to take the same approach with the much more complex 2012 London Olympics, and now to modelling the semantic content of their news output. They speak for themselves here with an excellent short video.
The usage in the BBC begs the question of the potential applicability of RDF in commercial television - having all the metadata and information relating to advertising content as well as similar editorial needs to the BBC. In addition, and eminently suitable for RDF modelling, are all the data and metadata relating to advertising research.
1.7.2 Survey initiatives
Major international public sector survey and census organisations have sponsored the development of RDF standards for public survey data. The two initiatives of note are:
Data Documentation Initiative (DDI) RDF Vocabularies
This work is described in full at http://www.ddialliance.org/Specification/RDF. The objective is to create an RDF expression of a subset of the DDI model. At the time of writing the expected release of this specification is in the very near future. This work models reference metadata and structural metadata. An experimental implementation may be found at http://ddi-rdf.borsna.se/ hosting metadata across 1490 studies and 140k questions and supporting SPARQL queries across all this metadata.
1.7.2.1 The RDF Data Cube Vocabulary
This is a W3C recommendation as of January 2014 - http://www.w3.org/TR/vocab-data-cube/. The domain of interest is aggregate statistical data, including survey data, and is based on the concepts and terminology of Statistical Data and Metadata Exchange (SDMX: http://sdmx.org/). The recommendation defines an RDF representation for the structures variously known as hypercubes, OLAP cubes, pivot tables and their subsets the cross-tabulation and frequency distribution.
This is the same space as has been explored with market research survey specific initiatives and discussed at other times at ASC – TabsML and XtabML being XML representations of the same kind of information.
1.8 RDF in consumer survey research
The need for standardisation of survey metadata has been recognised for many years and addressed in many different ways – a useful review of the issues arising and ongoing solutions may be found in (Westlake, 2007).
There seems to be a difference in the needs of adhoc survey practitioners and those who conduct very large and/or continuous studies over many years and multiple countries.
An adhoc survey is typically constructed on an urgent here-today-gone-tomorrow basis, and its usefulness is not expected to be enduring; at the other extreme from the major public studies.
Although adhoc researchers recognise the potential benefits of accumulating knowledge across many surveys, there has never been a perception of the value sufficient to support much investment in curating knowledge from questionnaire data.
Proprietors of panels have more to gain potentially, if only from respondent good will by not asking the same questions repeatedly. The complexity of modelling not just metadata about old surveys but the individual data themselves typically has defeated this objective.
However – the obstacles that have made supporting survey systems on databases from the relational era so difficult, including:
· New schema every day as well as new data
· Schema varying over the course of collecting data
· Categorical variables
· Hierarchical code lists
· Internationalisation of questionnaire content
are almost a catalogue of the benefits from modelling data as RDF.
The author determined to make an experiment to see if it was possible to store
· Reference metadata
· Structural metadata
· Respondent data
· Aggregate data
· Translation memory
for multiple surveys, in an single RDF triple store. In other words to use RDF to create an archive of surveys containing ALL the data.
If realised, with acceptable performance, this would allow queries across all these levels of data and across multiple surveys, and also greatly simplify the sharing of these data between organisations.
The DDI and SDMX initiatives mentioned above address the metadata and aggregate data agenda, but (so far as the author is aware) there has been no attempt to store individual response data in RDF as well.
2 Practical work with RDF
The Triple-S standard (http://triple-s.org) is well familiar within the ASC community and attractive for this exercise because metadata and data from many questionnaire packages can be exported or coerced into this format.
The author already possessed knowledge of Triple-S and tools for processing Triple-S datasets, and, since Triple-S is much less heavyweight than DDI or SDMX, Triple-S was an obvious starting point.
The project progressed through the following stages:
1. Develop an RDF vocabulary corresponding to the elements and attributes of Triple-S XML version 1.2.
2. Develop a utility to convert Triple-S metadata into an RDF document
3. Install a triple-store to host the RDF and experiment with analysing metadata across multiple surveys using SPARQL queries
4. Extend the RDF vocabulary to model individual response data as well.
5. Extend the utility to convert response data into RDF
6. Load some surveys, including a major survey, as individual data
7. Experiment with SPARQL queries for extracting individual data across surveys and making aggregate queries such as frequency distributions
8. Develop an RDF vocabulary to model distributions and cross-tabulations of Triple-S variables
9. Experiment with SPARQL queries to create such aggregate data as new RDF
2.1 Rendering Triple-S data as RDF
2.1.1 Triple-S metadata expressed as RDF
The first step was to construct a graph model of the
information found in a Triple-S 1.2 XML schema: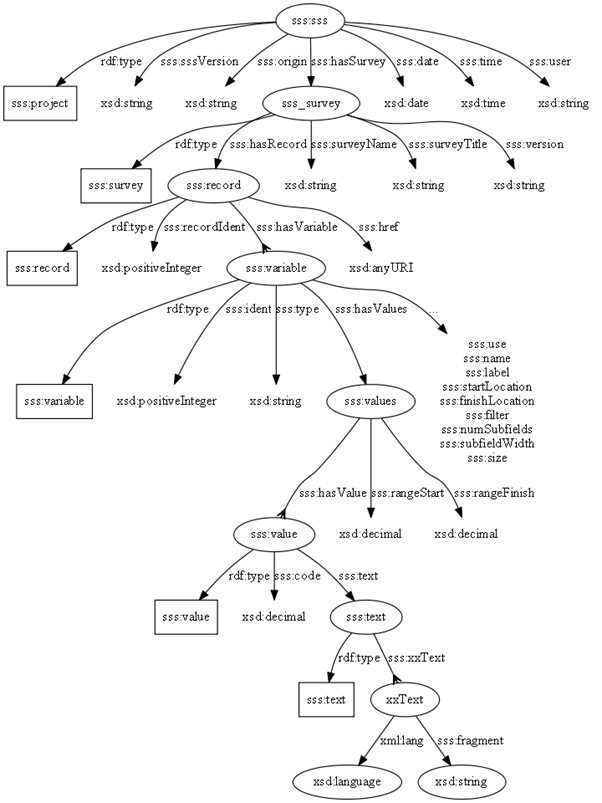
Although it might well be appropriate to make some structural changes for a formal RDF conversion (for example introducing Dublin Core vocabulary), it was felt that the decision process required would distract from the main objective which was a proof-of-concept for RDF and survey data. So the structure shown is a very literal rendering of the Triple-S model.
The diagram shows a representation of multi-lingual texts though this was not (yet) fully implemented.
The diagram is an implicit ontology for Triple-S survey data in RDF – a formal ontology has yet to be devised.
In the diagram rectangles represent the class of some item, i.e. there is a unique URI for each class, and ellipses instances of triples, i.e. there will be a URI for each instance. A crows-foot shows a one-to-many relationship.
The sss: is a URI prefix identifier. The author took the liberty of assigning http://triple-s.org/sw/2014/08-19/1.2 as the URI prefix for Triple-S RDF.
2.1.2 Conversion of metadata
To distinguish the triples of the museum survey from triples of other surveys in the store, the author allocated the URI http://rdf.x-mr.com/sss12/example to associate with the museum dataset itself.
The utility when run on the Triple-S example (museum) survey in the documentation generated 175 triples to describe the schema; here is an excerpt:
<http://rdf.x-mr.com/sss12/example#variable_Q1> a sss:variable
;
sss:finishLocation 1 ;
sss:hasValues <http://rdf.x-mr.com/sss12/example#values_Q1> ;
sss:ident "1" ;
sss:label "Number of visits" ;
sss:name "Q1" ;
sss:startLocation 1 ;
sss:type "single" .
The fragment describes one of the variables. The Triple-S properties are clearly visible in the eight triples. Note that the variable has been assigned a URI that is guaranteed to be unique to that variable no matter how many surveys are loaded into the triple store.
Once this process was established the author used it to load several publicly available surveys into the triple store. No data processing was required once the data set was available in Triple-S format, so this is the work of moments for each survey.
2.1.3 Surveys loaded
2.1.3.1 General Social Survey (GSS)
“The GSS contains a standard 'core' of demographic, behavioral, and attitudinal questions, plus topics of special interest. Many of the core questions have remained unchanged since 1972 to facilitate time-trend studies as well as replication of earlier findings. The GSS takes the pulse of America, and is a unique and valuable resource. It has tracked the opinions of Americans over the last four decades.” (GSS General Social Survey)
The GSS is conducted by National Opinion Research Centre and kindly made available for research. This work was conducted with the Merged Single-Year Data Set for 2012, downloaded in March 2014.
GSS is a survey with substantial metadata, having 805 variables in Triple-S representation, and 1,974 records in 2012.
2.1.3.2 UK Living Costs and Food Survey, 2010: Unrestricted Access Teaching Dataset
These data are a subset from the full survey, provided for experimental and teaching purposes. The dataset has 14 variables and 5,262 records.
2.1.3.3 Quarterly Labour Force Survey, January - March, 2011: Unrestricted Access Teaching Dataset
This subset database has 13 variables and 25,162 records.
2.1.3.4 Triple-S example dataset
This was taken from the Triple-S standard description. It has a tiny number of variables and cases to demonstrate the features of the standard.
2.1.4 Querying metadata
The following examples show SPARQL queries operating on the data and metadata in the triple store.
This paper does not attempt to introduce the features of SPARQL. In production use the SPARQL would be concealed behind front-end applications. The point is that many data and metadata applications can be realised with a very modest amount of SPARQL code.
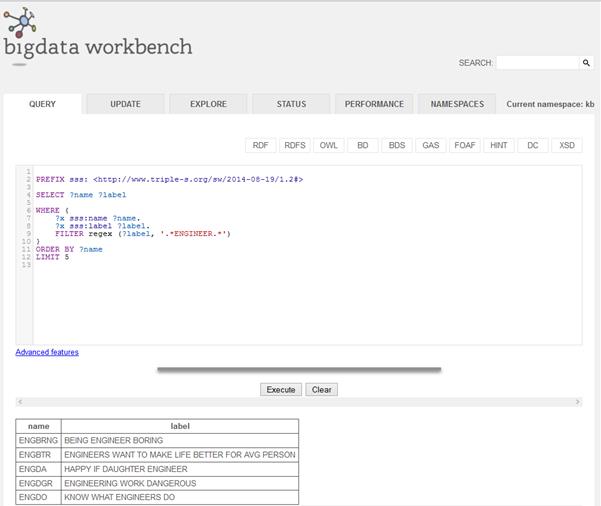
2.1.4.1 List of variables (in any survey) having ENGINEER in their label
2.1.5 Extending the model with case data
Triple-S does not define an XML representation for case data, so it was necessary to create an RDF model from scratch.
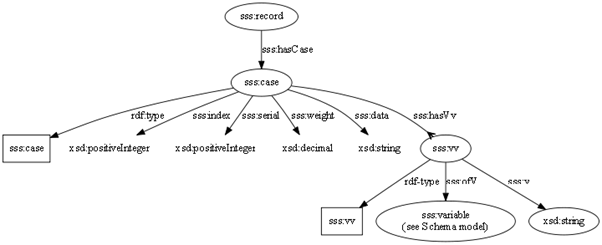
The model introduces a “case” resource for each data record associated with a Triple-S record declaration along with the properties implied by Triple-S semantics. It includes the complete ASCII data as a string (sss_data) as well as an individual resource for each non-missing data value in the case (sss:vv). The variable value resource links to the associated variable, and to the value – the string in the data columns defined for the variable in the schema.
Thus we get three triples for each defined data value – in the case of GSS for instance there are 816,048 data values.
2.1.6 Analysing case data
2.1.6.1 List of surveys with number of cases
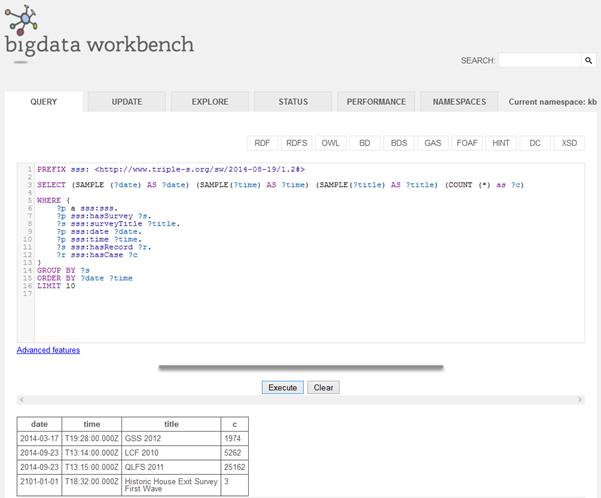
2.1.6.2 List values of a specific variable by respondent
This example shows how a SPARQL query can engage with the metadata and individual data simultaneously.
If some of the various surveys share respondents, e.g. in a panel scenario, then an RDF resource could be created for each panel respondent, and each individual survey case linked to its corresponding respondent. Once this link exists then SPARQL queries can use the links to consolidate the response across all respondents – making it simple, for instance, to identify all the questions ever answered by a specific respondent and the responses.
Similarly, if a variable can be identified as a UK postcode, then SPARQL queries can retrieve all kinds of geographic data to enhance the data collected by interview, as described above.
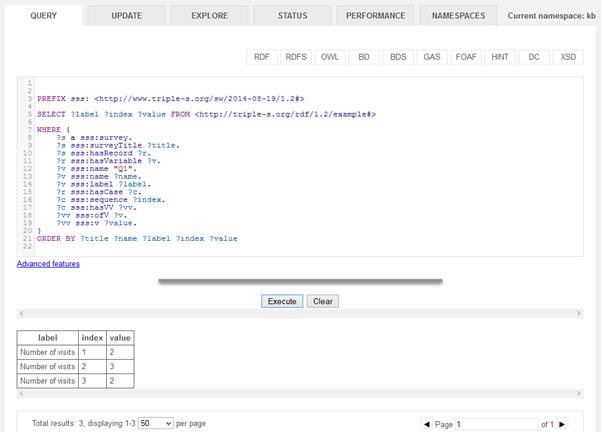
2.1.6.3 Frequency distribution of a question
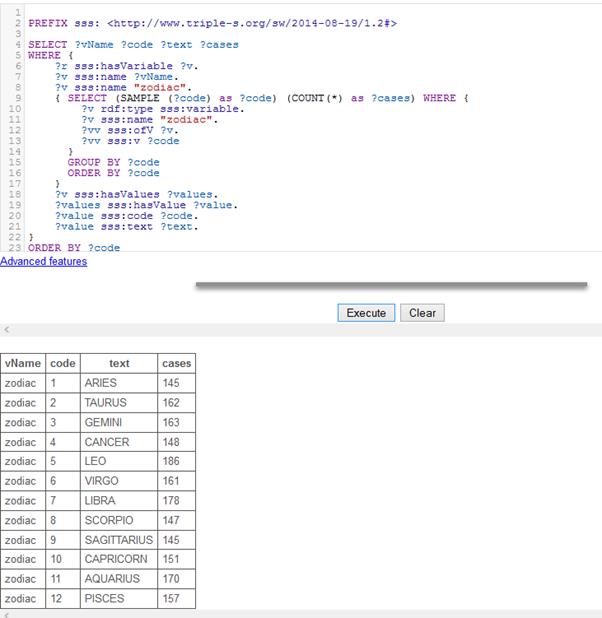
This shows an aggregate query across GSS 2012.
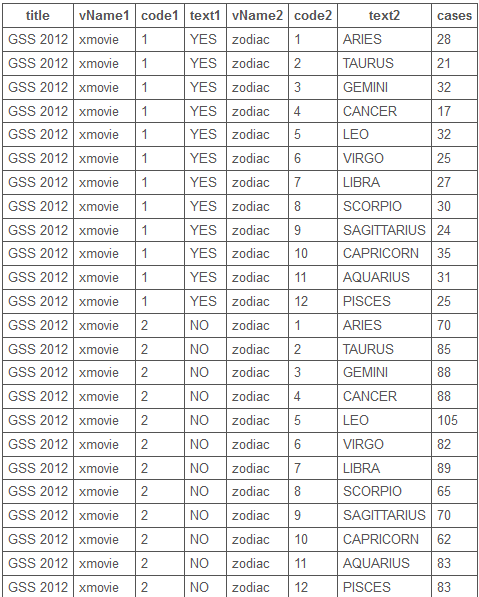
2.1.6.4 Cross tabulation of two questions
2.1.7 Modelling aggregate data
Based on the author’s prior experience with XtabML, and some experiments with RDF Datacube, it seemed that a simpler representation of distributions and cross-tabs could be created by relying on the Triple-S variable definitions rather than duplicating them. To this end an RDF model of aggregates was devised as follows:
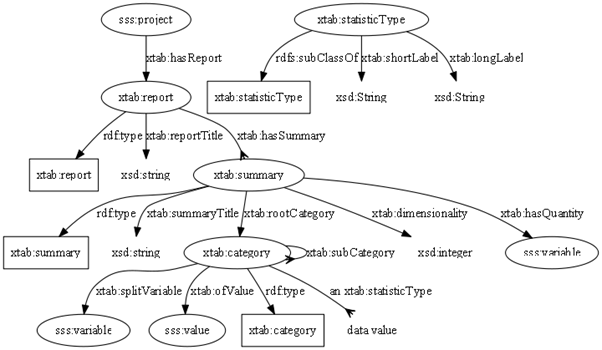
This can model totals, distributions, cross-tabulations and hypercubes where the dimensions are Triple-S variables – in other words it is based on an existing Triple-S dataset and relies on its metadata. It defines ‘report’ resources associated with a Triple-S project.
The triples in the earlier examples were all created externally by the Triple-S conversion utility. Triples for this aggregate model can be created entirely as the result of SPARQL aggregate queries, similar to the previous example, and added to the triple store. They then become data that can themselves be queried by SPARQL for use in reports, weighting, sampling or whatever.
In other words the cross-tabulations are truly data themselves, and presenting them as conventional tables is only one of the things that can be done with them.
2.2 Building a survey archive
To facilitate experimenting with RDF on your own data X-MR will shortly make the Triple-S to RDF utility available for download under Open Source license at http://rdf.x-mr.com, so any of your existing Triple-S data can be simply converted to an RDF format.
Once you have installed one of the variety of triple stores you can just upload your Triple-S RDF and starting querying with SPARQL.
If you have existing data, such as spreadsheets, that you want to reformulate as RDF, then there is a category of tools out there to help. One in widespread use is OpenRefine (http://openrefine.org/), formerly Google Refine, and this has an RDF add-in:
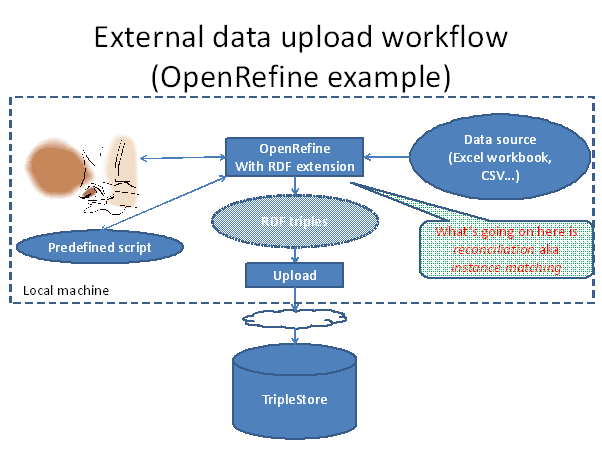
Part of the conversion process is changing column names and data values to appropriate UUIDs, to make them consistent across your data. In the RDF world this process is known as reconciliation.
However – a little goes a long way. If you can make your UUIDs consistent in just one dataset, that is already useful. If you can achieve it across several datasets, that’s very good. If you go on to make UUIDs conforming to a recognised vocabulary that is excellent. New benefits accrue from each step.
2.3 Further work
Applying RDF to survey data yields quite rich results from a modest amount of work. There are many things to do in order to fully realise the potential of this technology.
2.3.1 Standards
· Survey data ontology
o Use existing standards:
§ Metadata as DDI RDF
§ aggregate data as RDF datacube
o or formalise the experimental RDF formulation of Triple-S
o or Develop some lean-and-mean alternatives in the spirit of Triple-S, on an industry basis
· Product field ontologies – especially in media research
2.3.2 Tools
· User friendly query interfaces
· Workflow tools, e.g. bulk tabulation
· Export of questionnaires and samples
· Interface to statistical systems:
o Export of data
o Import of results to reuse as data
· Gateways to industry-wide and public data sources
· Extract data into publication formats
Summary
The author believes Resource Description Framework (RDF) is a very powerful platform to meet the challenges of managing survey research information in the second decade of the twenty-first century; in particular deploying that information as knowledge.
This paper has introduced RDF and described how it is starting to permeate the internet. It has explained how RDF contrasts with the established relational model and some options for deploying RDF technology in your organisation.
It has shown how RDF enables publicly available data to be “mashed up” with your survey response data.
It has concluded with a proof-of-concept implementation of a comprehensive survey archive based on RDF; demonstrating how with RDF the intelligence can be moved out of application code and into the data.
References
Clarke, A. C. (1961). Profiles of the Future.
GSS General Social Survey. (n.d.). Retrieved 09 21, 2014, from http://www3.norc.org/Gss+website/
Russell, B. (1926). Knowledge. Retrieved from http://www.marxists.org/reference/subject/philosophy/works/en/russell1.htm
Solve a teaching problem. (n.d.). Retrieved September 21, 2014, from Carnegie Mellon University: http://www.cmu.edu/teaching/solveproblem/strat-examhard/examhard-08.html
Westlake, A. (2007). Whither Statistical Metadata? in proceedings of ASC conference, Southampton. Retrieved September 22, 2014, from http://www.asc.org.uk/publications/proceedings/ASC2007Proceedings.pdf
Acknowledgements
UK Living Costs and Food Survey data are provided by:
· Office of National Statistics
· University of Manchester Cathie Marsh Centre for Census and Survey Research
and distributed by the UK Data Archive under joint Crown and UK Data Archive Copyright. These parties disclaim any responsibility for the processing herein.
Quarterly Labour Force Survey data are provided by:
· Office of National Statistics
· University of Manchester Cathie Marsh Centre for Census and Survey Research
and distributed by the UK Data Archive under joint Crown, UK Data Archive and Economic and Social Data Service Copyright. These parties disclaim any responsibility for the processing herein.
GSS:
Smith, Tom W, Peter Marsden, Michael Hout, and Jibum Kim. General Social Surveys, 1972-2012 [machine-readable data file] /Principal Investigator, Tom W. Smith; Co-Principal Investigator, Peter V. Marsden; Co-Principal Investigator, Michael Hout; Sponsored by National Science Foundation. --NORC ed.-- Chicago: National Opinion Research Center [producer]; Storrs, CT: The Roper Center for Public Opinion Research, University of Connecticut [distributor], 2013.